Description
When running (on Linux, at least), Mailspring has a process named “main” that gradually leaks memory. After several days, memory usage can reach several GB. This process can be killed without bringing down the whole client. A replace process is started, staring off at around 200 MB, but this too will gradually leak memory.
The process in question is in a hierarchy like so:
mailspring (pid 1763473) → Mailspring defa (pid 1763664) → mailsync (pid 3149390) → main (pid 3149393)
The command that started it was:
/snap/mailspring/550/usr/share/mailspring/resources/app.asar.unpacked/mailsync.bin --mode sync --info robert@XXXXX.com
This has been the case for a while. I finally took the time to measure the memory usage. Here’s a plot of the resident memory (RSS) and virtual memory (VSZ) for one such process as reported by ps -o rss,vsz measured over 23 hours:
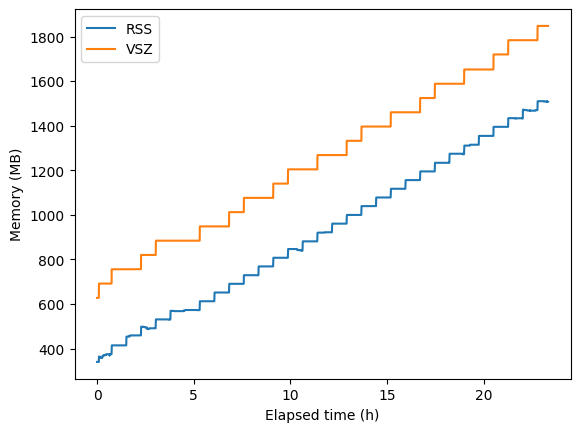
Measurements were made every 10 seconds [1]. This trace ends when the process ended. I didn’t kill it, but I don’t know if it ended itself, was killed by its parent, or killed by the oomkiller. During this time, I would have received 20-30 emails and sent 5 or so.
Both measurements show a pretty steady growth. Since the RSS is more uniform, I looked into it in more detail. The increases in memory are regular in both size in period. The steps are not exactly the same height, but most are in the 10-15 MB range. Here’s a histogram of all memory increases greater than 5 MB:
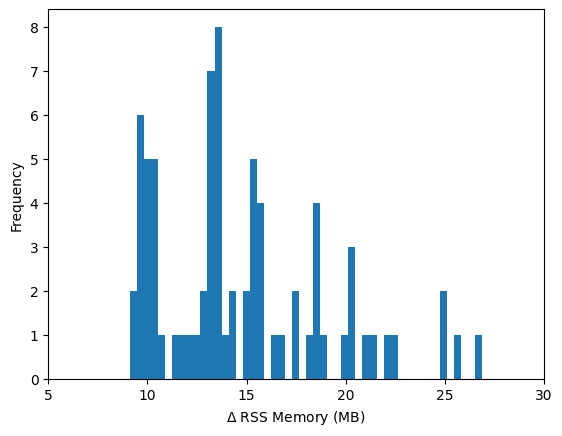
These steps occur on a regular period. Autocorrelation of the de-trended memory use gives a period of 45.5 minutes [2]. This may suggest some operation is running every 45 minutes, allocating 12 MB, and never releasing it. However, I think this is a node process, and it could be that node requests large memory chunks from the OS and then fulfills requests out of those chunks. So it may be that the operation is running more frequently and leaking less memory each time.
Although it’s hard to see in these plots, the RSS usage does decrease occasionally, albeit by very small amounts. The process is able to release memory, it’s just not doing that correctly all of the time.
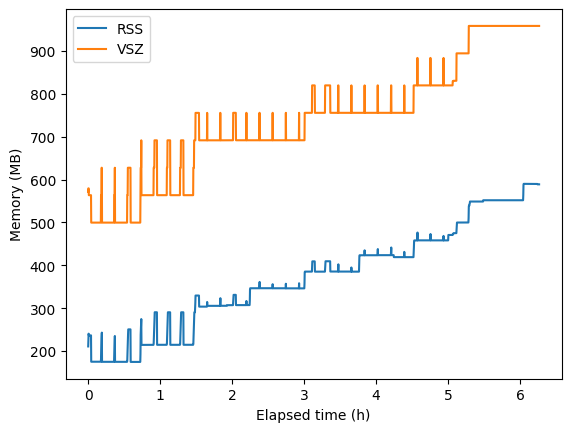
In another run, I did notice spikes in both the RSS and VSZ usage. (You don’t get to see the plot, because I’m limited to 2 media items, apparently. I’ll see if I can add it in a follow-up comment.) These spikes seem to occur about every 11 minutes, although they aren’t completely regular. They don’t really seem to line up with the stair-step growth, so I would wonder if this is an unrelated phenomenon. But I thought I’d mention it hear for completeness.
[1] Almost. I just slept for 10s between measurements, so the actual time between measurements would be a little bit longer. In this run, the average interval between measurements was 10.018s. I’ll keep referring to it as 10s for simplicity.
[2] The 10s sampling means that it could be a few seconds shorter or longer than that. But the peaks in the autocorrelation plot are very regularly spaced at 2730 seconds, so it can’t be off by too much.
To Reproduce…
Steps to reproduce the behavior:
- Run mailspring.
Having only one setup, I’m not sure exactly what’s necessary to trigger it. But this process always seems to grow in memory over time.
Expected Behavior
Memory usage is largely constant over periods of days.
Setup
- OS and Version: Ubuntu 24.04
- Installation Method: Snap
- Mailspring Version: 1.16.0-5339a49f
Additional Context
I have a single Google workspace account set up. The account is 10 years old now, containing tens of thousands of email threads. Most days, I receive 20-30 emails and send only a handful.
There is an old thread about memory usage here: High RAM usage (multiple GB) - #6 by tmanok . This might be the same issue, but none of the reporters provide details about the timing of the leaks. Since that thread is so old, I took the liberty of starting a new thread.